Package in R - "nlCor"
Most of the research in the field of Statistics is been done on
finding the relationship which is "Linear" in nature between
predictor-response and among predictor variables.
But there seems to be a very big Grey area where the focus has never been as much as expected looking at the benefits that area gives, "Non-Linear Relationships"!
The most common method used by Analysts and Data Mining practitioners is approximately find out the Non Linear relationship (say Logarithmic) among variables by creating a scatter plot and detecting the pattern manually.
But with higher number of data points it become meaningless to follow this method, also there is no Quantifiable measure for this kind of relationship.
To make our life easy, I have come up with a solution to this problem. This will not only help you to detect the Non Linear relationships among variables, with the output one can quickly transform those variables (setting a base for the feature engineering) and increase the accuracy of existing model.
First lets understand the difference between Linear and Non Linear correlation
Example of Linearly Correlated variables :
 As the graph suggests, data points seem to fall on a straight line as the value r (correlation coefficient) starts increasing. Plots with r=-0.9,0.9 and 1 has strong linear correlation.
Example of Non linearly correlated variables :

Here as we can see the variables X and Y has Non linear Relationship. But there is no Quantifiable measure to this relation.
It is easy to interpret this visually with less no of data points and with perfect Logarithmic relations (r = 1), but in the case of Non perfect relations, understanding the level of correlation becomes critical.
Instructions for installing "nlCor" in R:
For Windows :
Step 1) Install and Load the package 'devtools'
code :
> install.packages("devtools",dependencies=TRUE)
>library(devtools)
Step 2) Install and load the package "nlCor"
code :
> devtools::install_github("pratikpitreds/nlCor")
>library("nlCor")
For Ubuntu(16.04):
Step 1)
code :
#Open the terminal and run :
Step 2) Install and Load the package 'devtools'
code:
Open R or R studio Or start R through terminal
> install.packages("devtools",dependencies=TRUE)
>library(devtools)
Step 3) Install and load the package "nlCor"
code :
> devtools::install_github("pratikpitreds/nlCor")
>library("nlCor")
Example :
>y <- c(1,4,9,16,25)
>x <- c(1,2,3,4,5)
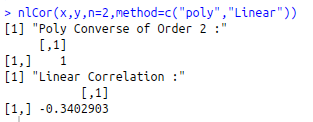
>nlCor(x,y,n=2,method=c("poly","Linear"))

But there seems to be a very big Grey area where the focus has never been as much as expected looking at the benefits that area gives, "Non-Linear Relationships"!
The most common method used by Analysts and Data Mining practitioners is approximately find out the Non Linear relationship (say Logarithmic) among variables by creating a scatter plot and detecting the pattern manually.
But with higher number of data points it become meaningless to follow this method, also there is no Quantifiable measure for this kind of relationship.
To make our life easy, I have come up with a solution to this problem. This will not only help you to detect the Non Linear relationships among variables, with the output one can quickly transform those variables (setting a base for the feature engineering) and increase the accuracy of existing model.
First lets understand the difference between Linear and Non Linear correlation
Example of Linearly Correlated variables :

Example of Non linearly correlated variables :

Here as we can see the variables X and Y has Non linear Relationship. But there is no Quantifiable measure to this relation.
It is easy to interpret this visually with less no of data points and with perfect Logarithmic relations (r = 1), but in the case of Non perfect relations, understanding the level of correlation becomes critical.
Instructions for installing "nlCor" in R:
For Windows :
Step 1) Install and Load the package 'devtools'
code :
> install.packages("devtools",dependencies=TRUE)
>library(devtools)
Step 2) Install and load the package "nlCor"
code :
> devtools::install_github("pratikpitreds/nlCor")
>library("nlCor")
For Ubuntu(16.04):
Step 1)
code :
#Open the terminal and run :
sudo apt-get install build-essential libcurl4-gnutls-dev libxml2-dev libssl-devStep 2) Install and Load the package 'devtools'
code:
Open R or R studio Or start R through terminal
> install.packages("devtools",dependencies=TRUE)
>library(devtools)
Step 3) Install and load the package "nlCor"
code :
> devtools::install_github("pratikpitreds/nlCor")
>library("nlCor")
Example :
>y <- c(1,4,9,16,25)
>x <- c(1,2,3,4,5)
>nlCor(x,y,n=2,method=c("poly","Linear"))
Comments
Post a Comment